
Logtape (https://logtape.org/) is a JavaScript library to manage logs. By default Logtape is only available for backend Javascript but you can use with moderne browser.
<script type="module">
import { configure, getLogger, getConsoleSink } from "https://esm.sh/@logtape/logtape";

await configure({
  sinks: {
    console: getConsoleSink(),
  },
  loggers: [
    { category: ["logtape", "meta"], sinks: ["console"], lowestLevel: "error" },
    { category: ["my-app"], sinks: ["console"] , lowestLevel: "debug" },
  ],
});

const logger = getLogger(["my-app", "main"]);

logger.info`Hello world!`;
logger.debug`Value is ${42}`;
logger.warn`test Warning`;
logger.error`test Error`;
logger.fatal`test Fatal`;

</script>
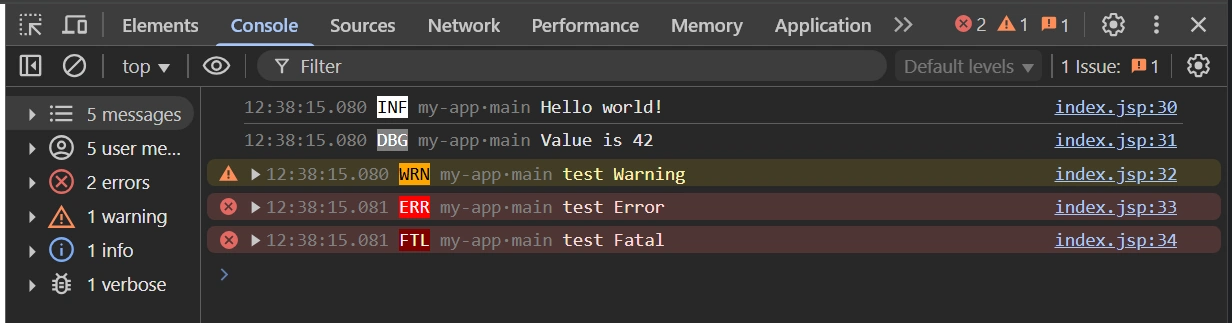
Dev Web Tools will display all logs because the lowest level is defined as « debug » :
We can imagine add an async request to logs with an HTTP Post Request. Logs will be send to the console and to HTTP request to the URL ./Logs .
<script type="module">

import { configure, getLogger, getConsoleSink } from "https://esm.sh/@logtape/logtape";
import { fromAsyncSink } from "https://esm.sh/@logtape/logtape";

const webhookSink = async (record) => {
  await fetch("./Logs", {
    method: "POST",
    headers: { "Content-Type": "application/json" },
    body: JSON.stringify({
      timestamp: record.timestamp,
      level: record.level,
      message: record.message,
      properties: record.properties,
    }),
  });
};

await configure({
  sinks: {
    console: getConsoleSink(),
    http: webhookSink,
  },
  loggers: [
    { category: ["logtape", "meta"], sinks: ["console"], lowestLevel: "error" },
    { category: ["my-app"], sinks: ["console","http"] , lowestLevel: "debug" },
  ],
});

const logger = getLogger(["my-app", "main"]);

logger.info`Hello world!`;
logger.debug`Value is ${42}`;
logger.warn`test Warning`;
logger.error`test Error`;
logger.fatal`test Fatal`;
Just one more thing:
A local storage is included into modern browser, so may be we can store data into this local storage to extract them with an external python program.
At first, just create a new sink (yes I remove ajax to keep only two sinks but you can let it) :
 sinks: {
    console: getConsoleSink(),
    localdb: localdbSink,
  },
   { category: ["my-app"], sinks: ["console","localdb"] , lowestLevel: "debug" },
  ],
Then a small function to store data :
const localdbSink = async (record) => {

  localStorage.setItem('logtape',
      JSON.stringify({
        timestamp: record.timestamp,
        level: record.level,
        message: record.message,
        properties: record.properties
      })
  );
};
You have to find the location of you profil with the browser URL « chrome://version/ », it will display something like that with windows OS about « Profil path »:
C:\Users\<username>\AppData\Local\Chromium\User Data\Default
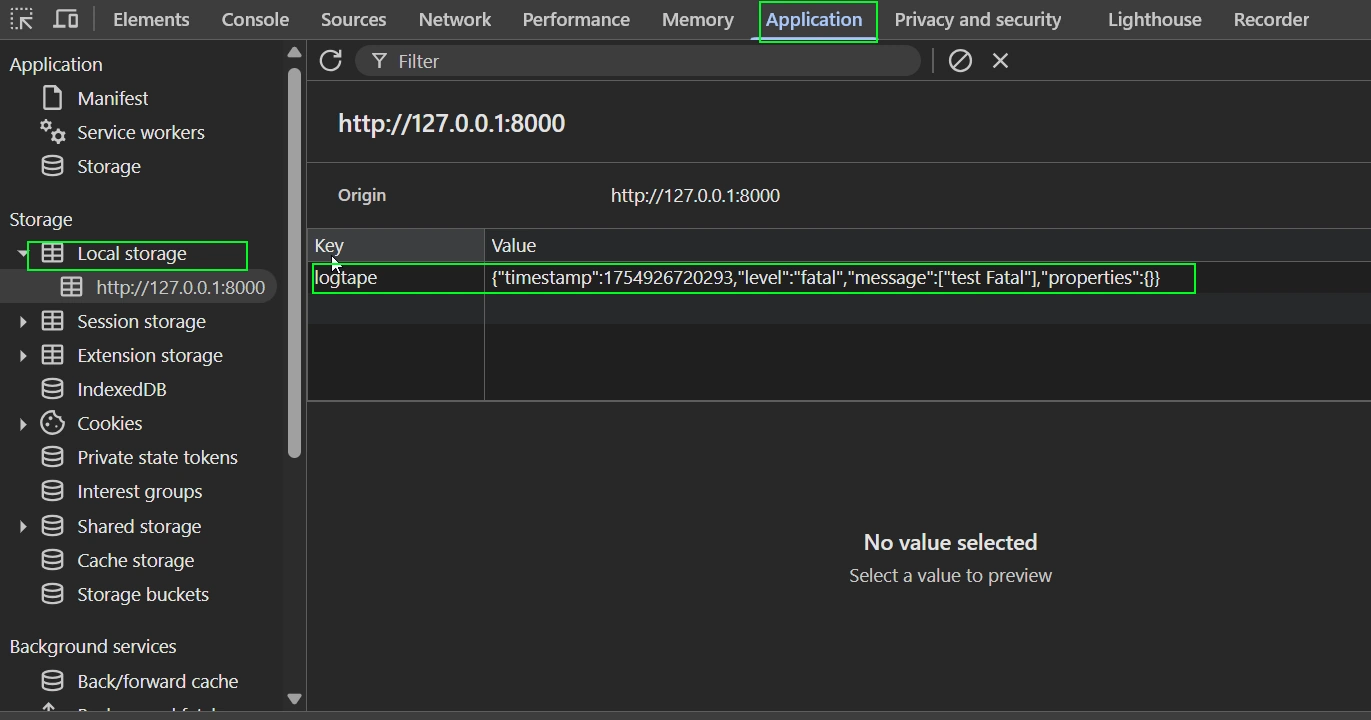
You can check the « database » with Dev Web tools :
We need a library in python called plyvel but it is not available with Windows, so I use Ubuntu WSL OS to create a script and access the LevelDB
import plyvel

db = plyvel.DB('/mnt/c/Users/<username>/AppData/Local/Chromium/User Data/Default/Local Storage/leveldb/', create_if_missing=False)


for key, value in db:
    if "logtape" in str(key):
      print( str(value ) )


db.close()
We can image a process to rescue log from the browser and check the application.